Find stocks with strong catalysts — and see whether price and sector confirm them.
See what happened and why it matters — the news that counts, scored and explained, in one view before the open and during the session.
For active day and swing traders in US stocks · morning briefing for the S&P 500, Nasdaq-100 and today’s small and mid caps in play · look up any US-listed ticker
7 calendar days for $0 · payment method required · we’ll remind you 2 days before your trial ends · cancel with one click
Context for your own decision — news, stock strength and sector strength in one view. Real example: NVDA on Thu 17 Sep 2026, 11:41 ET — news, score, stock and sector as Tailwind Trader showed them.
Instead of 59 headlines,
one clear picture.
Thursday, 17 September 2026. Nvidia is all over the news. Here is how Tailwind Trader puts the pieces together.
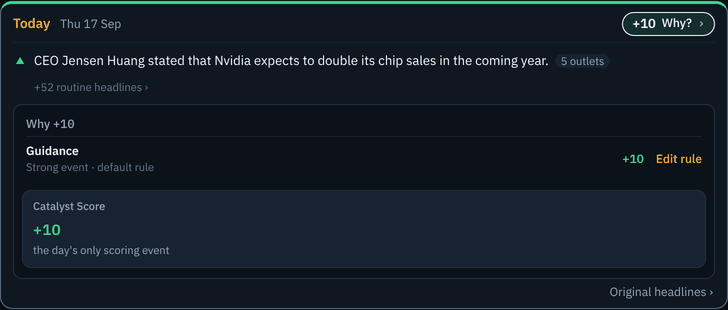
What happened? One event to focus on — not 59 headlines.
Seven reports of the same story become one scored summary. The other 52 headlines stay folded, one click away.

The 7 reports became one event, scored +10. The 52 routine headlines stay one click away, folded.
How much does it count — and why?
A Catalyst Score of +10. Click it and you see the reason: guidance from the company, a strong event, scored by the default rule. Change the rule and the score follows at once.
Do the stock and its sector agree?
News, stock and sector are compared on the time frame you choose — here 1h. All three point the same way: full tailwind.
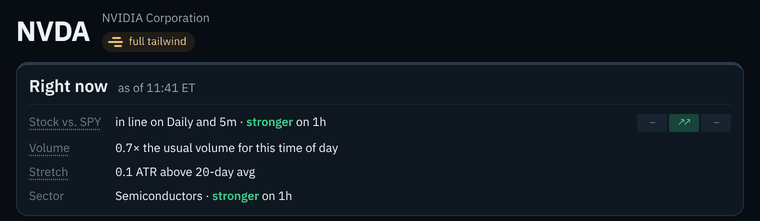
- Full tailwind on 1h
- ✓News +10 (positive)
- ✓NVDA stronger than SPY
- ✓Semiconductors stronger than SPY
How alignment is calculated
Full tailwind shows the direction, not how far the move has already gone. When a stock is unusually far from its 20-day average, the mark says so: far above 20-day avg.
Stock and sector are measured as relative strength against SPY, beta-adjusted. You choose the time frame — Daily, 1h or 5m; 1h by default, around the clock, so premarket gaps count. Works for longs and shorts. Tailwind describes the current situation; it is not a signal, a forecast or a recommendation.
7 calendar days for $0 · payment method required · we’ll remind you 2 days before your trial ends · cancel with one click
Know which news matters
before the opening bell.
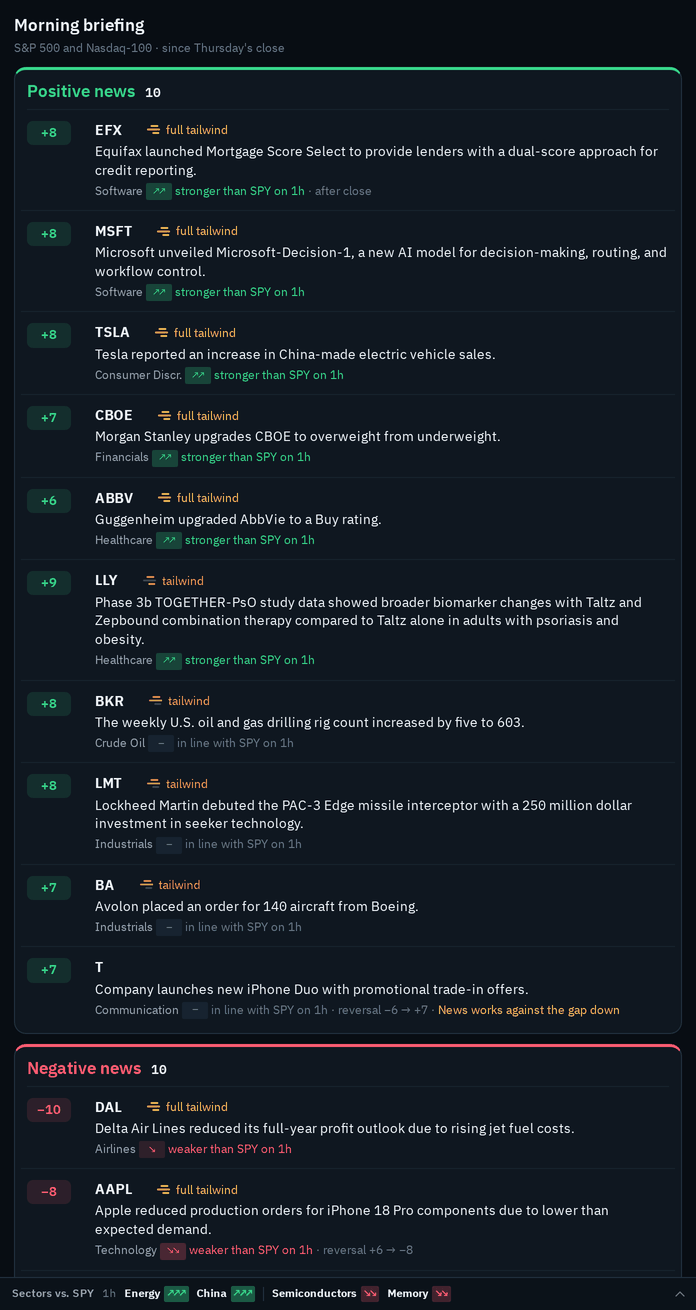
The biggest overnight catalysts, already sorted for you
The S&P 500 and Nasdaq-100 news since the last close, scored: positive, negative and mixed in boxes of their own, the sector on every line. When the stock or its sector works against the news, the line says so in plain words. A quiet morning is called a quiet morning.
Keep track of last week’s biggest catalysts.
See which of them remain stronger than the market.
Professional traders keep the stocks with the strongest catalysts on their radar for days — that’s where they look for new entries.
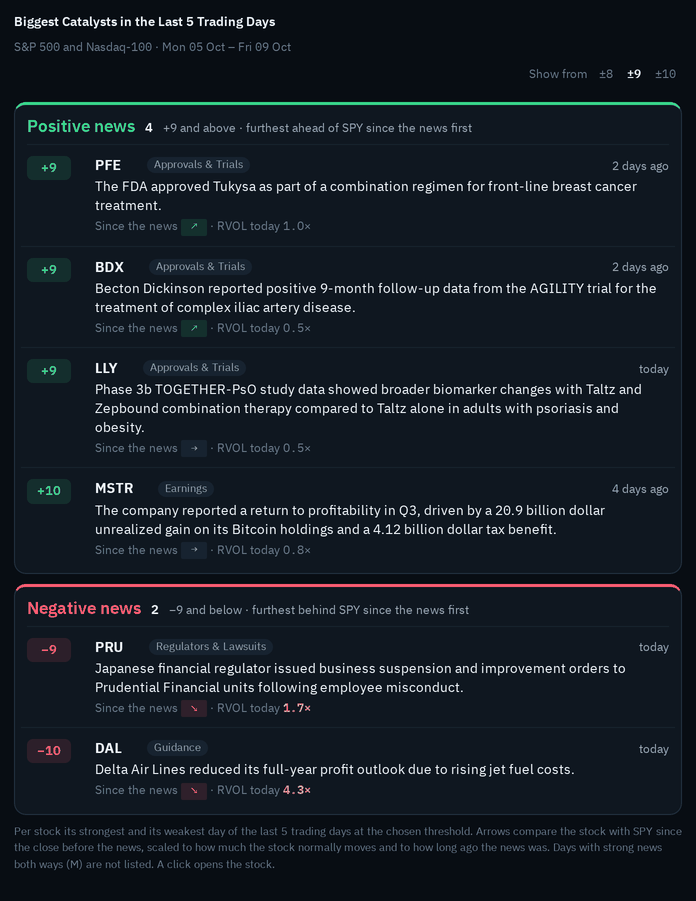
Real example: Fri 9 Oct 2026, 10:30 ET — the week’s strongest news and how each stock has moved against SPY since, as Tailwind Trader showed them.
Day 2, day 3 and beyond — still on your radar
We make sure you never lose track of the most important in-play stocks of the last few days:
- Day traders find second- and third-day plays and pullbacks after a big catalyst.
- Swing traders see which stocks with a strong catalyst are still stronger than the market, and look for an entry on a pullback, consolidation or a follow-up breakout.
Find the strongest stocks
in the strongest sectors.
See which sectors lead the market right now and which fall behind. Click one, and its strongest and weakest stocks are right there.
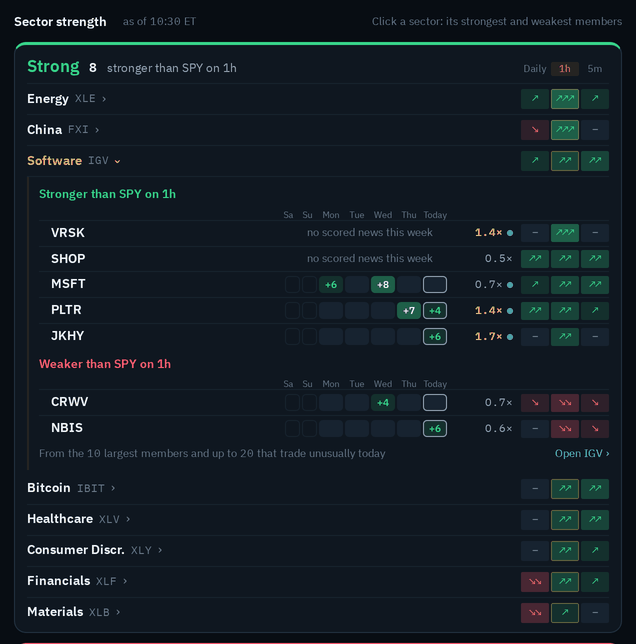
Where the market is strong — and where it’s weak
At a glance, all session long, without building a sector screen yourself. Works the other way too: the weakest stocks in the weakest sectors. Below, the small and mid caps that are in play today.
Never miss a big catalyst
on the stocks you trade.
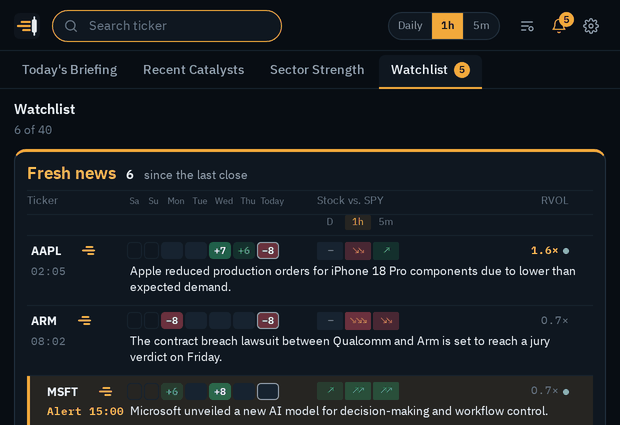
Only the news that can move your stocks, scored and on top
Every headline on your tickers is scored. Routine news stays out of the way; a ticker with a real catalyst moves to the top, with its last 7 days and whether it is stronger or weaker than SPY. Set a threshold, and you get notified when a ticker’s Catalyst Score crosses it.
Know a ticker’s latest story —
and whether the stock and its sector back it.

Real example: AAPL on Tue 13 Oct 2026, 10:30 ET — the week’s news, scored by the default rules, with that minute’s strength and volume.
The full picture of any ticker, in one view
Type a ticker: its last 7 days of scored news, how it trades against the market, its volume, its sector and its peers — everything you need before the trade, without opening five tabs. One click on any ticker copies it, ready to paste into your chart.
7 calendar days for $0 · payment method required · we’ll remind you 2 days before your trial ends · cancel with one click
No black box.
See why each news score was given.
Which event counted, how strong it was and which rule applied.
Outlet, ET time and a link to the original article — one click away.
Five outlets with the same story are one event, not five reasons.
Today never blends with last week. A morning without strong news says so in one line.
Start with default rules. Adjust them when you want.
Nothing to set up. If a kind of news matters more or less to you, move one slider — every score follows instantly. Illustrative example:
19 customizable event rules — earnings, guidance, analysts, contracts, legal and more. Set any of them to 0 to silence it.
What the earnings release doesn’t tell you.
Pulled from the call for you.
There is a reason professional traders listen to the earnings call, not just read the release: management often says more on the call. Tailwind Trader reads the call for you and shows you only what is new.

Real example: AMZN on Fri 30 Oct 2026, 10:30 ET — the morning after its Q3 call.
Only in the call, not in the press release
See at a glance what management said on the call that wasn’t in the release — good news, new worries or nothing new — and whether it backs the opening gap or works against it.
Never get caught off guard
by a market-moving release.
30 minutes before CPI, PPI, PCE, the jobs report, retail sales, GDP or an FOMC statement, a line appears at the top of your screen — time to tighten a stop or stay flat.

One plan. Everything included.
Pay monthly or yearly — you choose at checkout.
Then $49 a month or $468 a year — the plan you pick at checkout.
We’ll remind you 2 days before your trial ends. Cancel before then and nothing is charged.Prices in the EU and the UK include VAT; in the US, sales tax is added where applicable. The checkout shows the total before you confirm.
Questions before you put it next to your charts.
What is a Catalyst Score?
A number from −10 to +10 for each ticker and trading day. AI groups the headlines into events and classifies what happened; your event rules then decide, in plain code, how much each event counts. Click the score to see exactly which event counted and why. Changing a rule re-scores at once, without a new AI analysis.
Is “tailwind” a trading signal or a buy or sell recommendation?
No. Tailwind only describes whether three things point the same way right now: the news (its Catalyst Score), the stock’s relative strength against SPY and its sector’s relative strength against SPY, on the time frame you choose. Tailwind Trader never tells you to buy or sell a security.
It gives you the context, not the trade. Trading still takes the rest of your process — chart and technical analysis, position sizing and risk management. You make the decisions.
Which stocks are covered?
The morning briefing covers the S&P 500 and the Nasdaq-100, plus a short list of other stocks that trade heavily today and have scored news (“Small and mid caps in play”). You can look up any US-listed ticker and keep up to 40 on your watchlist. For a ticker outside the briefing, strength values usually appear a few minutes after you first look it up, and a sector comparison needs a sector we can assign it to. News coverage is broadest for large caps; for small caps it can be thinner.
What does Recent Catalysts show?
The strongest positive and negative news of the last 5 trading days in the S&P 500 and the Nasdaq-100, from a Catalyst Score of ±9 (you can choose ±8 or ±10). Each stock shows how far it has moved ahead of or behind SPY since the close before its news, measured in its own typical daily range and adjusted for how long ago the news was. It shows what has happened since the news; it is not a forecast.
What does “2.4 ATR above its 20-day average” mean?
The 20-day average covers about one trading month and is one of the most widely watched reference lines; many traders use it to judge whether a stock is near its recent “normal” or far away from it. ATR, the Average True Range, is the stock’s average daily range over the last 14 days, gaps included. Dividing by it makes the distance comparable across stocks: 3 ATR means “three normal days of movement” for any stock. From 3 ATR in either direction the value is highlighted in amber.
How does the free trial work?
Create your account, confirm your e-mail address, pick monthly or annual and add a payment method at checkout. Your trial lasts 7 calendar days and costs $0 today. We’ll e-mail you a reminder 2 days before it ends. Cancel before it ends and you pay nothing; otherwise your plan starts. One trial per person and per payment method.
Do I have to set up rules first?
No. Every event type starts with a sensible default weight. Change one only when you disagree — the scores follow instantly.
Will I get an alert for every new headline?
No. An alert fires only when a ticker’s Catalyst Score crosses the threshold you set (±5 to ±10); repeated coverage of the same story does not trigger a new alert. Alerts appear as a browser notification and in the in-app bell while Tailwind Trader is open in a browser tab.
Do I have to install anything? Does it work on a Mac?
Nothing to install. Tailwind Trader runs in any up-to-date browser at app.tailwindtrader.com — on Windows, Mac and Linux, and it adapts to your phone. You do not need TradingView either; one click on a ticker copies it, so you can paste it into whatever chart or platform you use.
Can I cancel? Do I get a refund?
Cancel any time with one click in your account; your access runs to the end of the period you paid for. If you withdraw within 14 days, you get everything back. Details: refunds.
Bring the context into your trading day.
What’s new, how much it matters by your rules, and whether the stock and its sector agree — in one view, before the open and during the session.
Start free trial7 calendar days for $0 · payment method required · we’ll remind you 2 days before your trial ends · cancel with one click